How might we use data to tell the story of how people were using
Divvy bike-sharing service in 2018?
Divvy is a bike rental service in Chicago which helped Chicagoans move around the city about millions of times in 2018. As a side project of the "invisible woman", I tried to convert massive data of Divvy bike usage in Chicago into compelling visualizations that reveal otherwise unseen trends and patterns in human behavior.
PHASE 1: DESIGN PROCESS
What do I want to know?
After conducting my secondary research in the project "invisible woman", I learned that there was an existing gender gap in Divvy usage. So the first thing I wanted to know was how serious it was, and I also curious how the ridership looked like in four seasons? Especially in Chicago's wintertime, under those flesh-gelling temperatures and chain-saw-like winds, would people even ride under these brutal conditions?
(Turned out in 2018 winter, people did ride, and male's overall ridership was visibly heavier than female.)
What do I need to prepare?
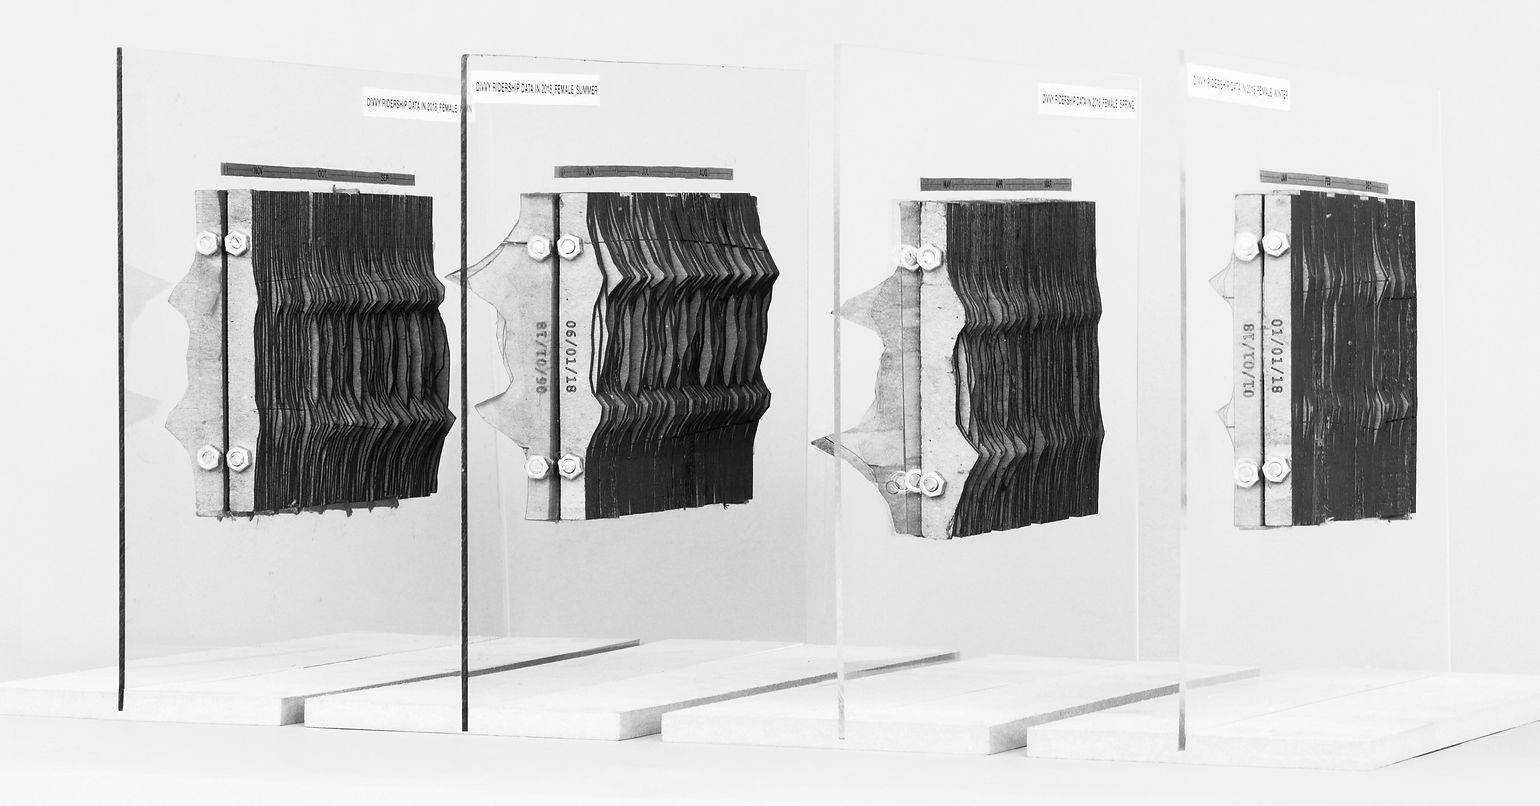
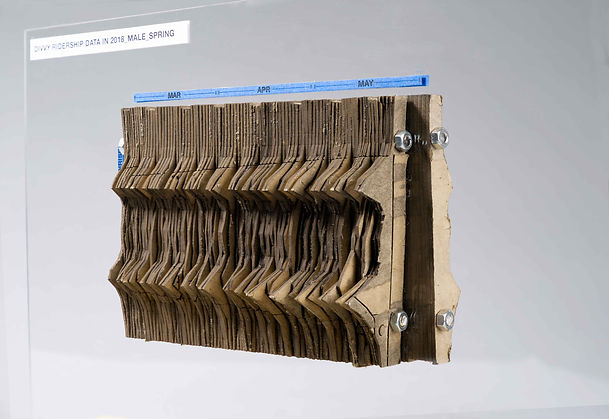
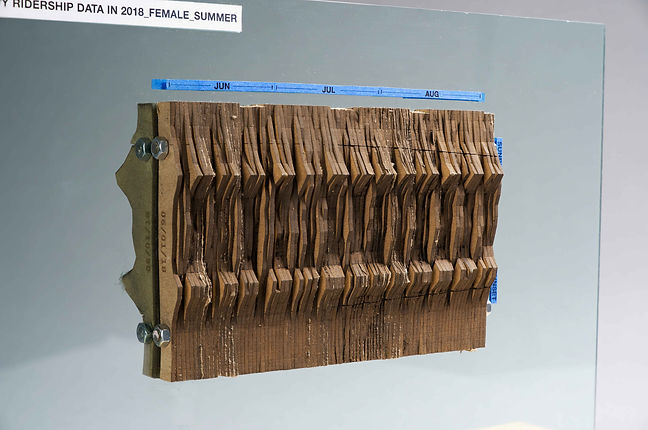
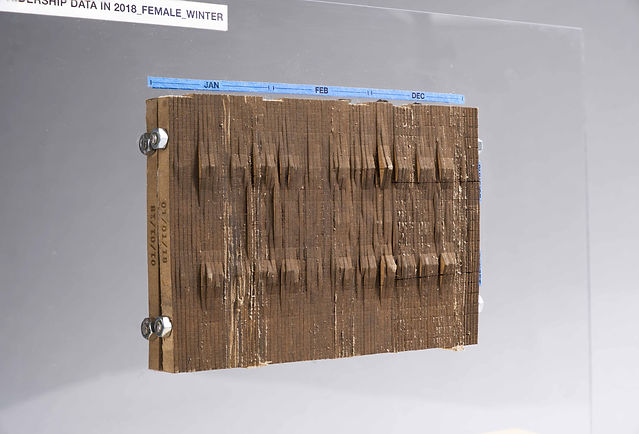
Dataset. Divvy shares its usage data every year to encourage people to play with it. I used its timing information and gender of every rider to visualize Divvy usage of the year 2018. The dataset contained near a million trips, so organizing an overwhelming amount of data and turning them into understandable visualizations were my biggest challenges.

Timing & Gender Data
Sunrise & Sunset Data
How to make it?
At first, I tried to use concept sketch to help me think through the 3-dimensional space.
Take a look at my few sketches.
After determining the final design, I used to create an algorithm based on the dataset, then mapping the algorithm in a 3D space.
After these, I used to process the lines and prepared for laser cutting.


From Laser Cutting To Assembling
PHASE 2: OUTCOMES

Autumn
MALE RIDERSHIP I FEMALE RIDERSHIP
Summer
MALE RIDERSHIP I FEMALE RIDERSHIP
Spring
MALE RIDERSHIP I FEMALE RIDERSHIP
Winter
MALE RIDERSHIP I FEMALE RIDERSHIP
VISUALIZATION
Take a look at the short video to get an overall sense of the male & female ridership in 2018 (video starts from Jan 1st, and ends on Dec 31st).
How to read?

PHASE 3: LEARNINGS
Learning 1
Male ridership is approximately 3 times over than females. Take March as an example, one can easily tell the difference. It seems to be that both male and female ride more from noon till night.

Sunrise
Sundown
Sunrise
Sundown
Female's Ridership
Male's Ridership
Learning 2
Visibility matters. It's not surprising that Divvy's ridership increased dramatically from winter to summer. But what is interesting to me is that there is a connection between the duration of the daytime and ridership, in other words, when daytime becomes longer, people ride more.
Take the right picture as an example, when winter turning into summer, the ridership per day is increasing (compare the blue zone and the red zone vertically), and the duration of the ridership is expanding (compare them horizontally).


Sunrise
Sundown
Sunrise
Sundown
Male's Ridership
Male's Ridership
Learning 3
Two different traffic models exist. One is "weekday", which has two visible peaks represent rush hours; the curve of another is more gentle, which is "weekend". These two traffic models imply different scenarios.

Male's Ridership
Male's Ridership
"Data alone will never give us a solution, and this is why data failed us so badly because we failed to include the right amount of context to represent reality,
a nuanced, complicated and intricate reality."
——Giorgia Lupi "How we can find ourself in data"
GALLERY WALK
DIvvy Ridership/per day_Spring 2018
Male's Ridership

Female's Ridership


Left: Male Ridership
Right: Female Ridership
DIvvy Ridership/per day_Summer 2018

Male's Ridership
Female's Ridership


Left: Male Ridership
Right: Female Ridership
DIvvy Ridership/per day_Autumn 2018


Male's Ridership
Female's Ridership


Left: Male Ridership
Right: Female Ridership
DIvvy Ridership/per day_Winter 2018

Male's Ridership
Female's Ridership


Left: Male Ridership
Right: Female Ridership


SPECIAL THANKS TO...
Zach Pino for modeling & advising.
Daniel Chichester for photographing.